Blog Details
Blog Details
5 Statistical Red Flags in Your CRO's Phase I Oncology Protocol
5 Statistical Red Flags in Your CRO's Phase I Oncology Protocol
This Article — 5-Minute Read
This Article — 5-Minute Read

Moving from preclinical work into first-in-human trials is nerve-wracking. There's pressure from investors, timelines are tight, and most early-stage biotechs don't have the bandwidth to build out a full internal clinical operations team. So they hire a CRO.
CROs bring operational muscle — site networks, regulatory infrastructure, global reach. But the Phase I protocols they draft often come from templates. Old templates. And when a CMO or VP of Clinical Development signs off on one of these documents without a deep statistical review, problems get baked in that are expensive to fix later.
We're not talking about minor inefficiencies. A poorly designed Phase I protocol can waste 12 to 18 months, burn tens of millions in funding, and lock in a dose that's either too toxic or too weak to ever succeed in Phase II. The old approach of pushing toward maximum tolerated dose made sense for cytotoxic chemo, but targeted therapies, bispecifics, and immunotherapies don't work that way. Regulators know this. They now expect adaptive designs, integrated PK/PD modeling, and precise endpoint definitions.
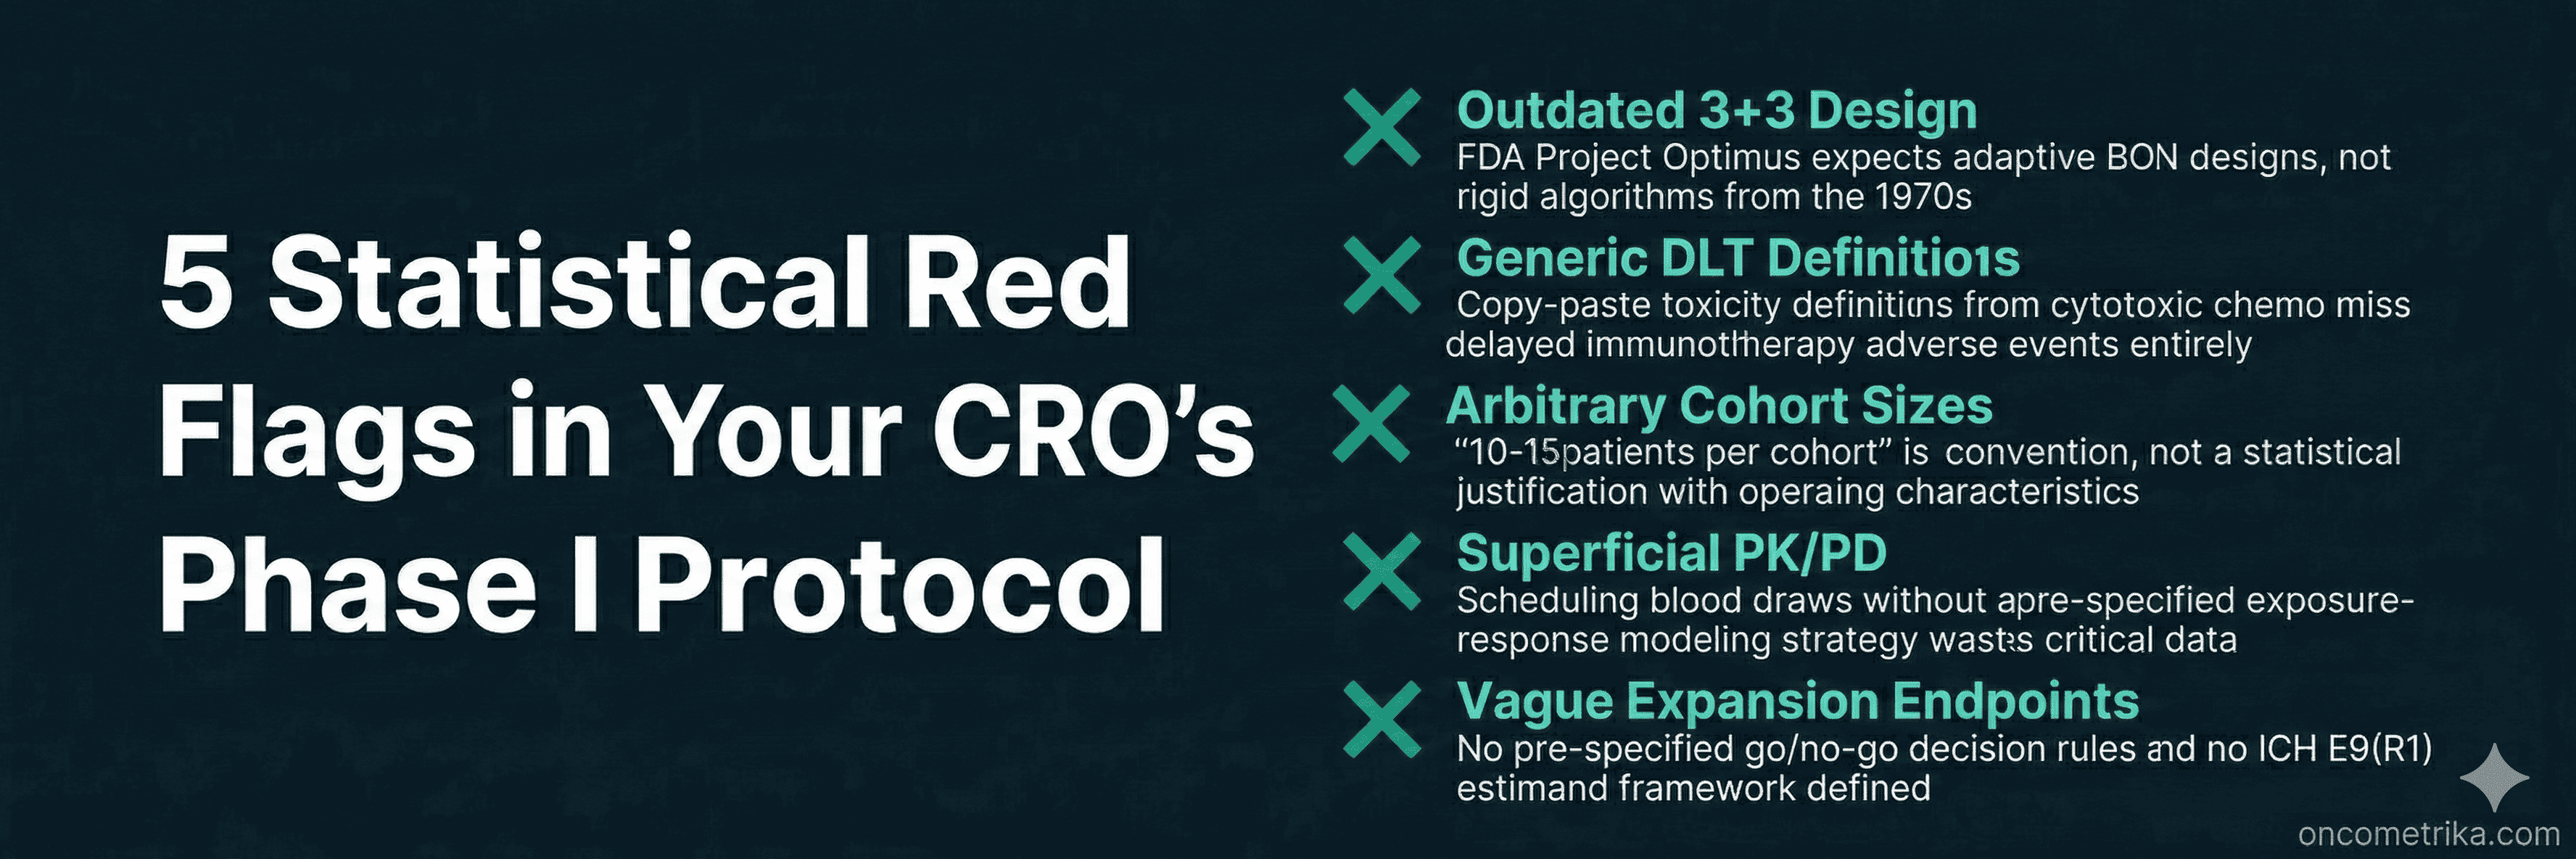
At OncoMetrika, we review a lot of CRO deliverables. These are the five statistical red flags we see most often — and the ones most likely to cause problems downstream.
Red Flag 1: Still Using 3+3 Dose Escalation
The 3+3 design has been around for over fifty years. CROs still use it because it's simple, familiar, and doesn't require specialized software or a statistician in the room during dose-escalation meetings.
But 3+3 is built on an assumption that doesn't hold for modern oncology drugs: that toxicity and efficacy rise together, and that the goal is finding the maximum tolerated dose. This works fine for cytotoxic chemo. It fails completely for targeted therapies, ADCs, and checkpoint inhibitors, where therapeutic effect often shows up well below the toxicity ceiling.
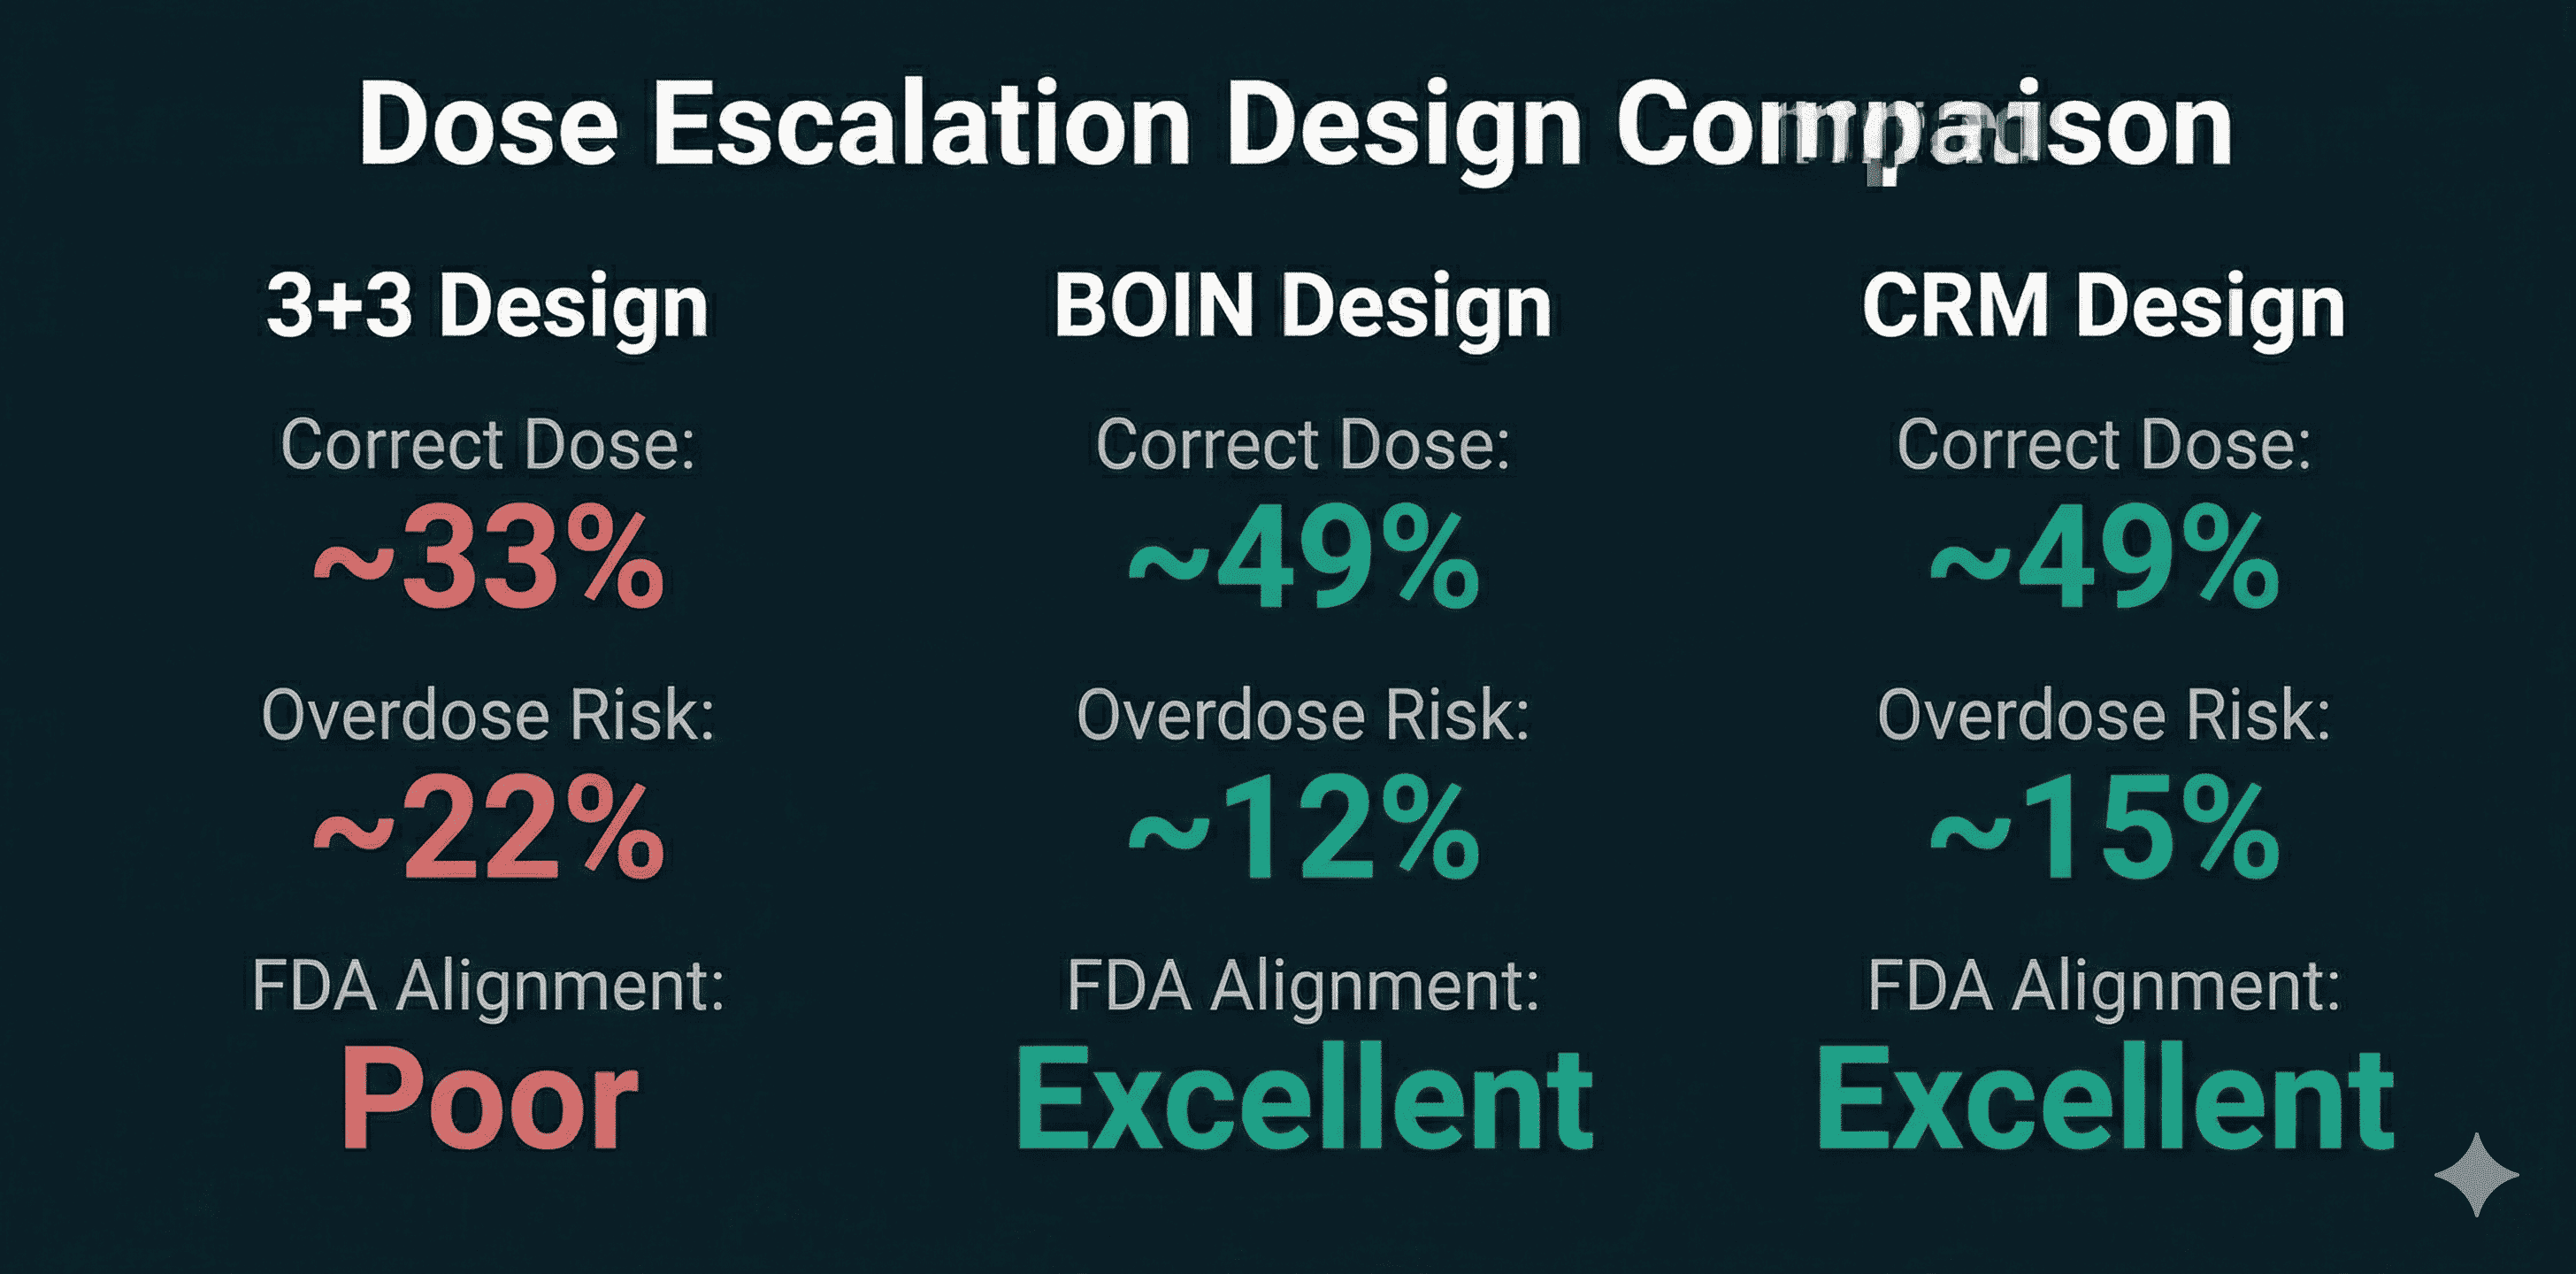
The numbers are not kind to 3+3. Simulations consistently show it identifies the correct target dose only about 33% of the time. Roughly 22% of patients end up at overdose levels. Model-assisted designs like BOIN or mTPI do significantly better — around 49% correct dose selection, with far fewer patients exposed to toxic doses.
What the FDA Expects Now
The FDA's Project Optimus initiative has made this explicit. Sponsors are expected to move beyond MTD-centric thinking and demonstrate real dose optimization — finding a dose that balances safety and efficacy, not just the highest dose patients can tolerate. A protocol built on 3+3 without strong justification signals to reviewers that the sponsor isn't taking dose-response characterization seriously.
What to Look For
The statistical section should include simulation results comparing 3+3 against alternatives like BOIN, mTPI, or CRM. We've written previously about why BOIN and model-assisted designs now represent the standard for modern oncology dose-finding — the operating characteristics are simply better. If the protocol defaults to 3+3 without explaining why these alternatives were rejected, that's a problem. Ask for operating characteristics tables. Ask for the probability of correct dose selection under different scenarios. If your CRO can't produce these, the statistical foundation of your trial is weak.
Red Flag 2: Copy-Paste DLT Definitions
Dose-limiting toxicity definitions determine when escalation stops. They're the safety gate for your entire trial. A huge red flag is when a CRO uses generic DLT definitions pulled from old cytotoxic protocols and applies them to immunotherapy or targeted agents.
Cytotoxic drugs cause acute, predictable toxicities — myelosuppression, neutropenia, severe nausea — typically within the first 21 to 28 days. A 21-day DLT window makes sense for those drugs.
Immunotherapies are different. Immune-related adverse events like pneumonitis, colitis, and thyroiditis can show up weeks or months after dosing. A protocol that defines a 21-day DLT window for a checkpoint inhibitor will systematically miss these delayed toxicities. The escalation algorithm will keep pushing the dose up when it should have stopped.
The Specificity Problem
Vague language is another issue. "Any clinically significant Grade 3 toxicity" sounds reasonable but introduces dangerous subjectivity. Different investigators interpret this differently, which degrades data quality and makes dose decisions inconsistent across sites.
Good protocols use CTCAE-based criteria with explicit exceptions tailored to the drug's mechanism. For a kinase inhibitor, transient Grade 3 fatigue lasting under seven days might reasonably be excluded from the DLT definition. Asymptomatic liver enzyme elevations without bilirubin increases might also be carved out. These decisions should be made upfront based on the pharmacology, not left to investigator judgment.
What to Look For
Check that the DLT observation window matches the expected time-to-onset of severe toxicities for your modality. For immunotherapies, consider 42 to 84 days or a time-to-event adaptive design. For ADCs with cumulative payload toxicity, extended monitoring beyond cycle one may be necessary. Generic definitions copied from chemo protocols are a statistical liability.
Red Flag 3: No Justification for Expansion Cohort Sizes
Phase I protocols increasingly include expansion cohorts after initial dose escalation. The idea is to get preliminary efficacy signals and better characterize safety in a more homogeneous patient population. The problem is that these cohorts are often sized by convention rather than calculation.
"10 to 15 patients per cohort" or "up to 20" — these numbers appear in protocols without any statistical justification, simulation results, or power calculations. It's guesswork dressed up as planning.
Why This Matters
The FDA has explicitly warned against expanding cohorts without complete Phase I safety and PK data. Expanding too fast exposes patients to unnecessary risk and generates misleading efficacy estimates.
Think about the math. If the true response rate is only 5%, what's the probability that a 14-patient cohort will produce enough responses to falsely declare the drug active? If the true response rate is 30%, what's the probability that random variation will yield zero or one response, killing a promising asset?
What to Look For
The statistical section should include operating characteristics — false positive rates, false negative rates, probability of correct decision across a range of plausible scenarios. This level of rigor is standard in oncology biostatistics consulting but often missing from CRO templates. If the expansion cohort is designed to seek an efficacy signal, there should be pre-specified thresholds for declaring success or futility. Simon's two-stage design, Bayesian predictive probability bounds, or lower confidence intervals for response rate should be defined before the first patient is enrolled.
Without documented statistical justification, arbitrary cohort sizes risk generating underpowered data that can't support real go/no-go decisions.
Red Flag 4: PK/PD Treated as an Afterthought
For targeted therapies and biologics, the optimal biological dose is often well below the maximum tolerated dose. Finding it requires integrating pharmacokinetic and pharmacodynamic modeling into the trial design — not tacking it on as an operational checklist.
A red flag is a protocol that schedules sparse PK blood draws at convenient times without any pre-specified modeling strategy. The samples get collected, but there's no plan to actually use the data to inform dosing decisions.
The Questions PK/PD Should Answer
Does the drug achieve sufficient systemic exposure? Does it engage the target in the tumor? Does target modulation translate into clinical benefit? Answering these questions requires population PK models and mechanistic PK/PD integration. For targeted therapies, sigmoidal Emax models quantify the relationship between drug concentration and biological effect. For combinations, simple interaction factors aren't enough — you need models that characterize synergism, additivity, or antagonism.
What the FDA Expects
FDA guidance on exposure-response relationships explicitly requires sponsors to integrate exposure-response assessment into all development phases. A protocol that lacks a formalized population PK and exposure-response strategy will produce data that can't satisfy Project Optimus requirements for dose justification.
What to Look For
The statistical section should explain how sampling time points were optimized to capture Cmax and AUC with precision. It should describe the regression methodology linking exposure to response. It should explain how pharmacodynamic markers will inform optimal biological dose selection. If PK/PD appears only as a vague "will be evaluated" statement, the protocol is incomplete.
Red Flag 5: Vague Endpoints in Expansion Cohorts
Seamless Phase I/II designs promise faster development by combining dose escalation with preliminary efficacy evaluation. But they often suffer from endpoint ambiguity that causes problems later.
A protocol raises concerns when expansion cohorts lack precise primary objectives, pre-specified decision rules, or adherence to the estimand framework.
The Decision Rules Problem
If an expansion cohort is designed to seek an efficacy signal, you need actual statistical thresholds — not just observational data collection. Simon's two-stage design allows early termination for futility if minimum response thresholds aren't met. Bayesian predictive probability bounds or specific lower confidence intervals for response rate should be built into the protocol. Without these, you end up with ambiguous data that can be interpreted however people want to interpret it.
The Estimand Problem
The ICH E9(R1) addendum introduced the estimand framework. An estimand defines exactly what treatment effect you're measuring. It has five components: treatment condition, population, endpoint, strategy for handling intercurrent events, and summary measure.
Intercurrent events — dose reductions, rescue medications, early discontinuation — happen constantly in oncology trials. The protocol must specify how these events will be handled statistically. Will the analysis use a treatment policy strategy and ignore intercurrent events? A while-on-treatment strategy that only counts outcomes before the event? A hypothetical strategy estimating what would have happened without the event?
CRO protocols often punt on this entirely. That leaves interpretation to post-hoc decisions, which invites regulatory criticism and opens the door to data manipulation.
What to Look For
Before the first patient is dosed, the protocol should have a clear estimand framework. It should specify handling strategies for the intercurrent events most likely to occur. Without this, expansion cohort data becomes vulnerable to missing data artifacts and interpretational bias.
Questions to Ask Your CRO
Before signing off on a Phase I protocol, ask these questions:
Has 3+3 been compared against model-assisted designs? Request simulation results showing why BOIN or mTPI was rejected.
How have DLT definitions been customized for this modality? The observation window should match the drug's mechanism and half-life.
What are the operating characteristics for expansion cohort sizes? You need false positive and false negative probabilities, not just a number pulled from convention.
How does the PK sampling schedule support exposure-response modeling? Look for population PK and mechanistic Emax modeling, not just descriptive analysis.
What are the go/no-go decision rules for expansion cohorts? There should be mathematical thresholds for futility and advancement.
How does the protocol define estimands per ICH E9(R1)? Strategies for dose modifications, rescue meds, and early discontinuation should be specified upfront.
Does the design allow for dose optimization before registrational trials? The protocol should support evaluation of multiple dose levels to find the optimal biological dose.
Conclusion
The statistical design of your Phase I protocol sets up everything that comes after. A flawed design wastes time, burns capital, and generates data that can't support real decisions.
The five red flags — outdated escalation designs, generic DLT definitions, arbitrary cohort sizes, superficial PK/PD, and vague expansion endpoints — are the most common problems we see in CRO-drafted protocols. They're also the most consequential.
Getting Phase I right protects patients, preserves capital, and produces data that actually means something. Alignment with FDA Project Optimus and ICH E9(R1) isn't optional anymore. It's baseline expectation.
If you need a second opinion on your Phase I statistical design, OncoMetrika reviews protocol sections for oncology biotechs preparing for IND submission.
Our Recent Blog


Your cancer trial data deserves more than a generalist.
Whether you need a statistical analysis plan for your Phase II solid tumor study or a network meta analysis for your NICE submission, let's talk.
Your cancer trial data deserves more than a generalist.
Whether you need a statistical analysis plan for your Phase II solid tumor study or a network meta analysis for your NICE submission, let's talk.
Your cancer trial data deserves more than a generalist.
Whether you need a statistical analysis plan for your Phase II solid tumor study or a network meta analysis for your NICE submission, let's talk.